PROJECTS
ABOUT
EXTRAS
PROJECTS
ABOUT
EXTRAS
Infographic | Poster
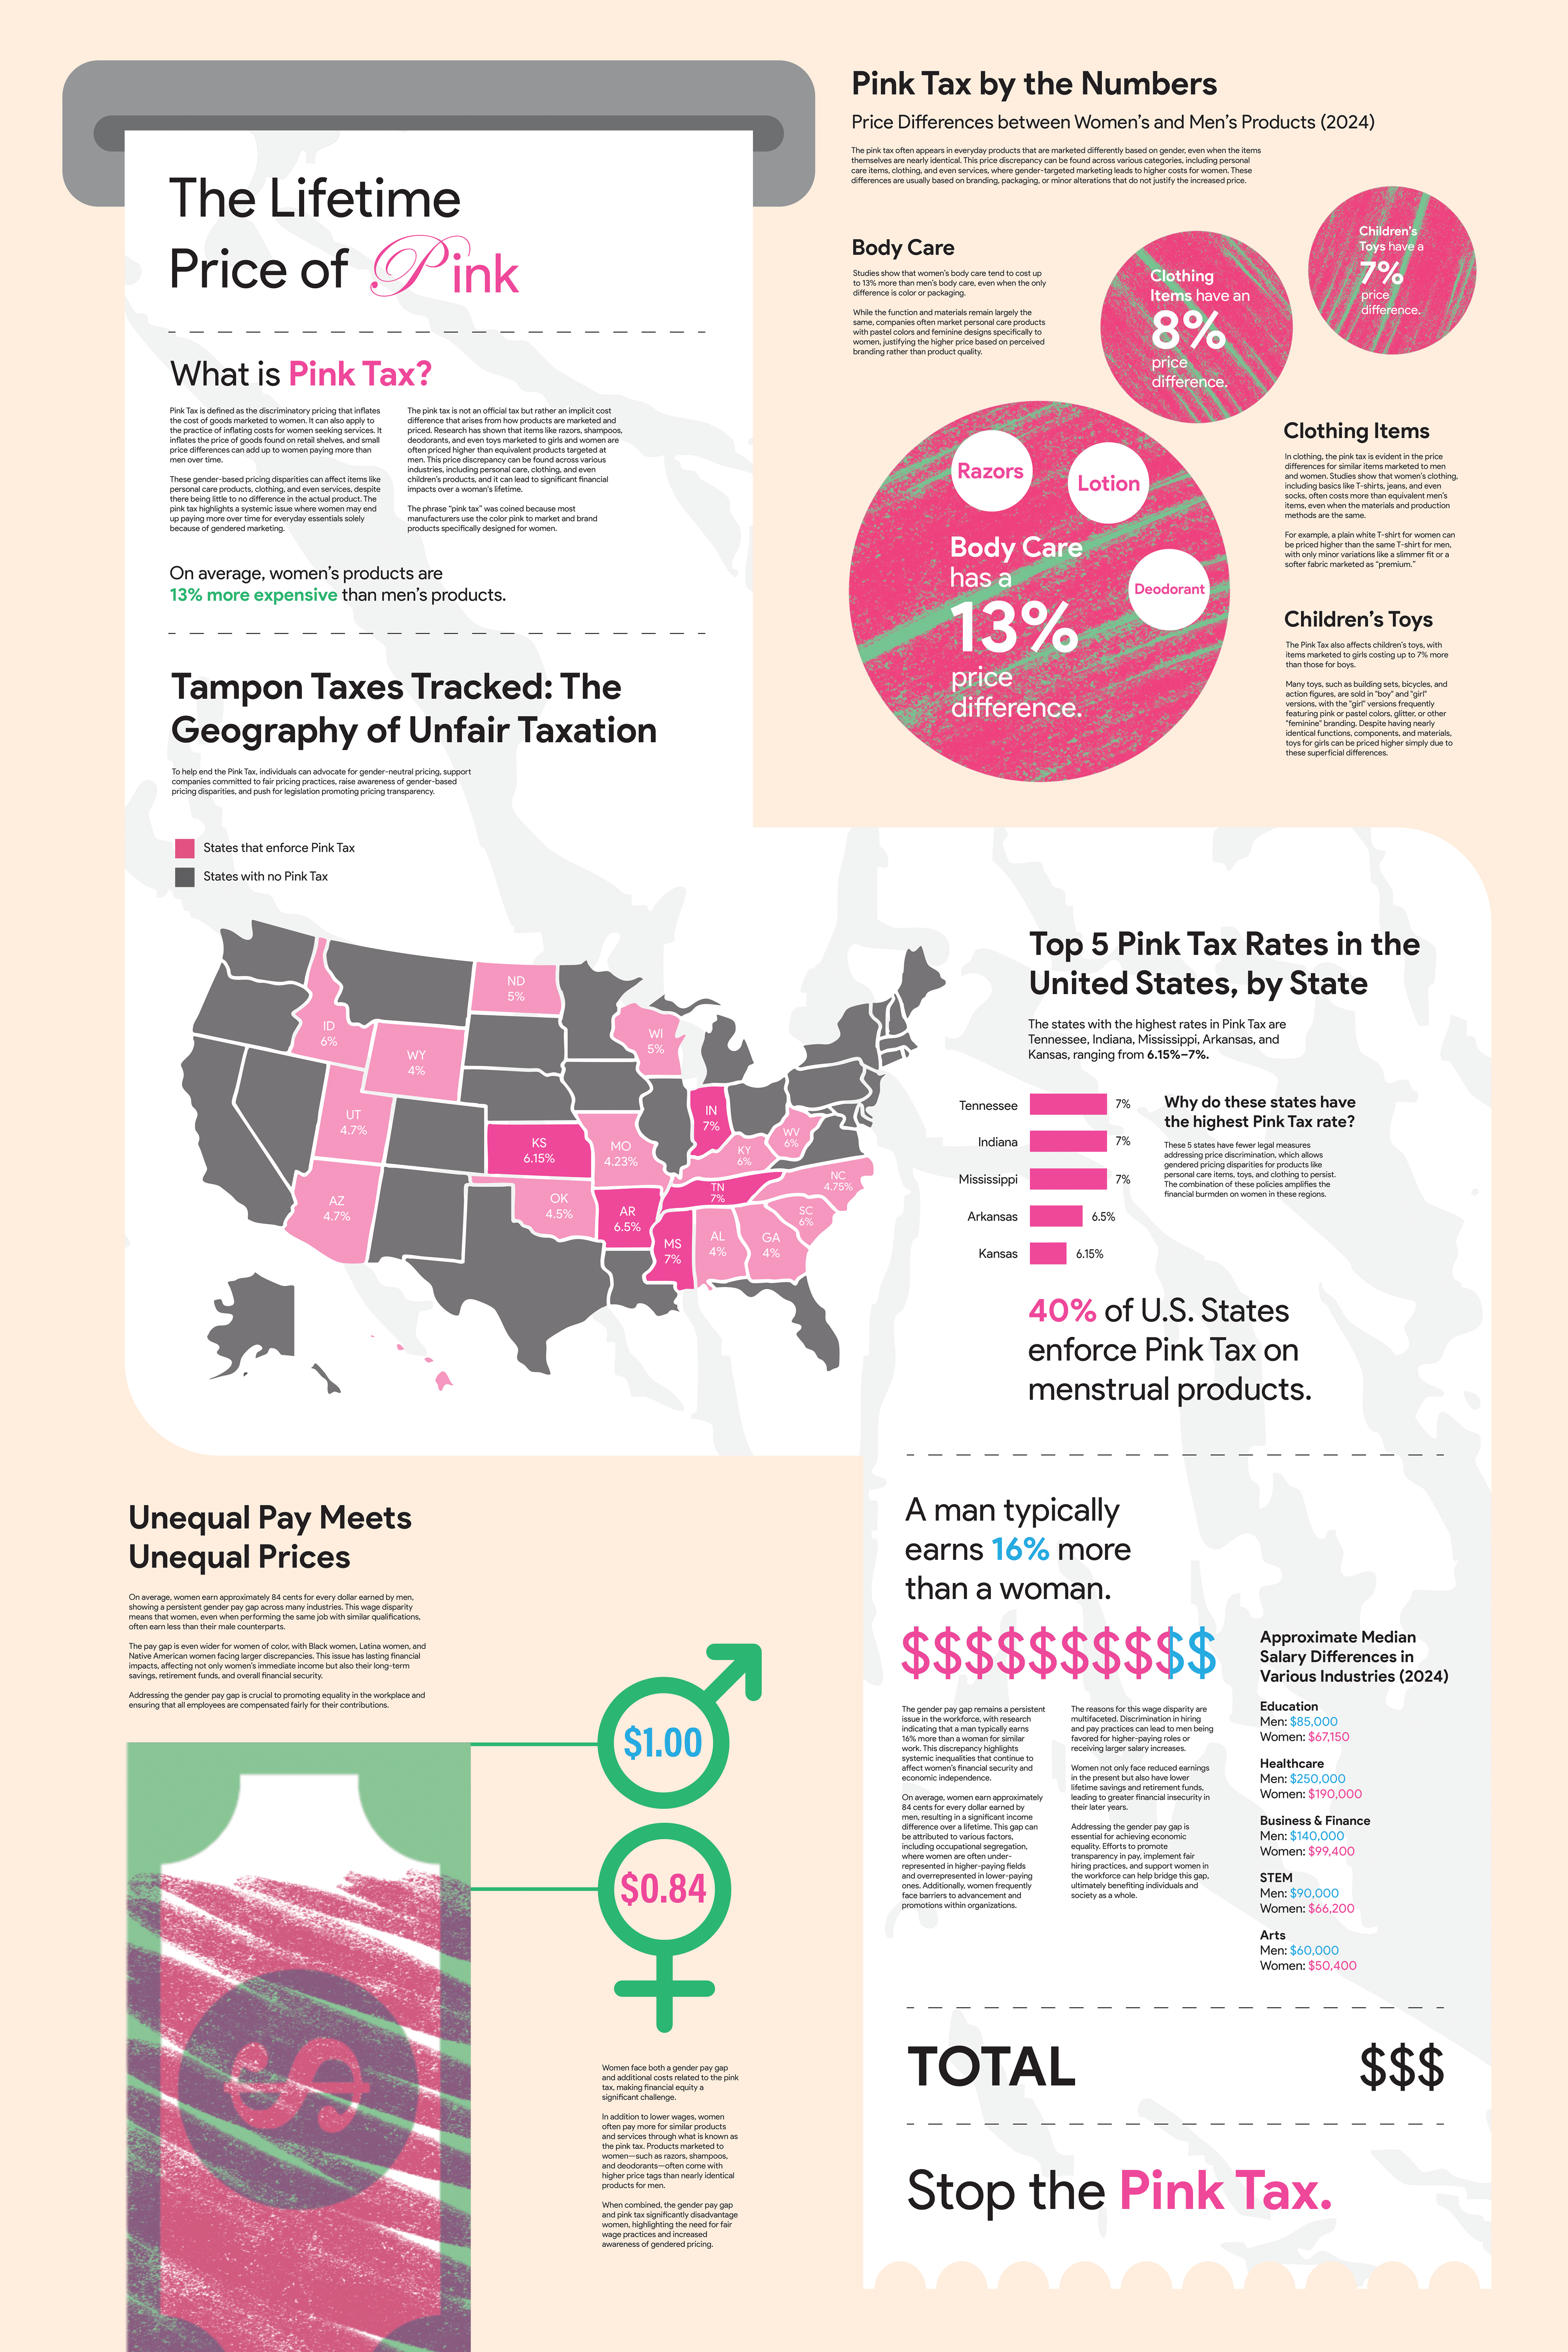
A data-driven
infographic
highlighting the impact of the pink tax. The design incorporates structured organization and dynamic elements to effectively communicate key statistics and insights.